
Calc + LabPlot / Data & analysis
Silicon Atlas
Five editable plots that keep passing, failing and unknown operating points visible.
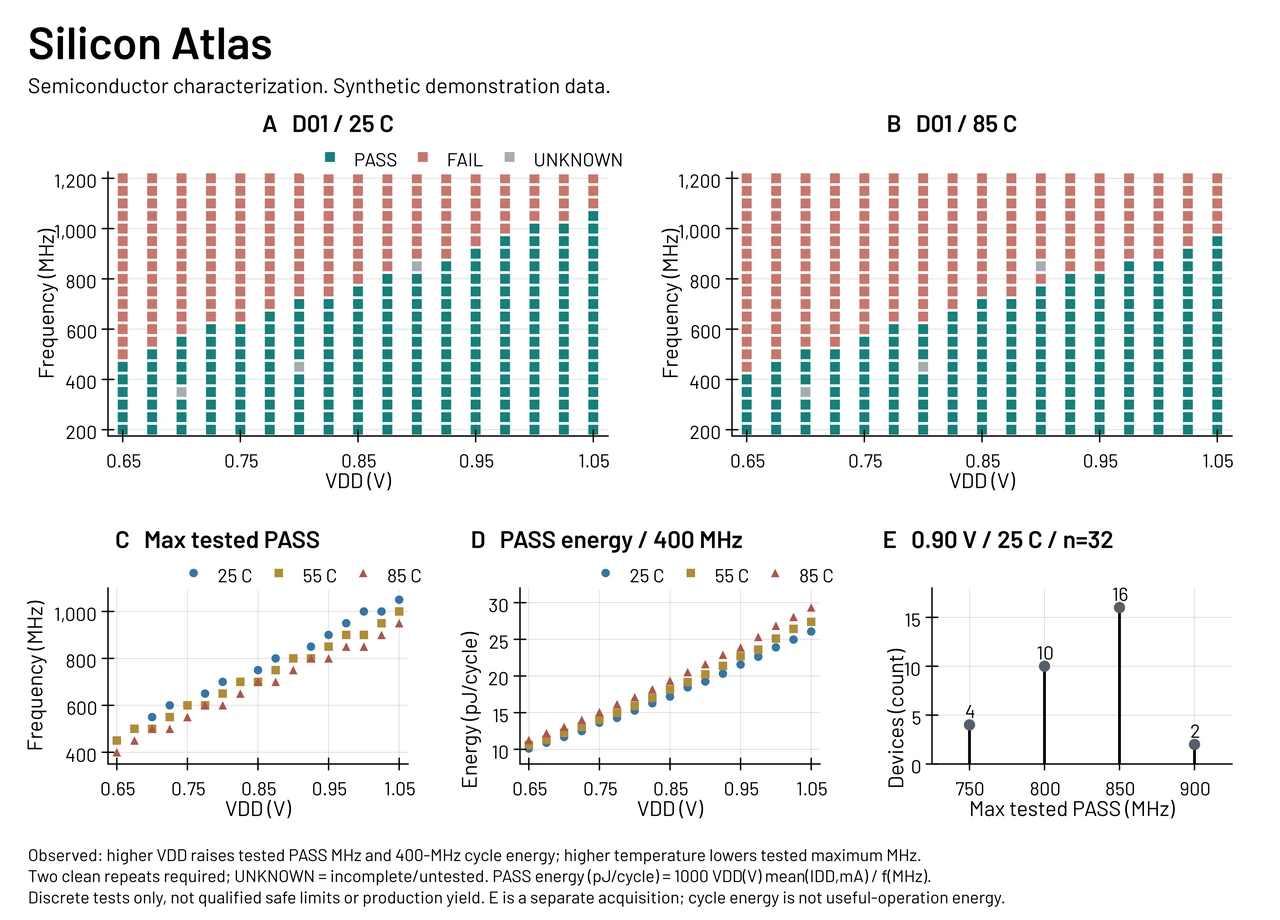
The five-panel Silicon Atlas produced in Calc and LabPlot.
NorthCUA brand edition. Editorial logos are updated; the recorded GUI sequence and timing are preserved.
Film chapters
YOUR TURN / INSPECT THE DATA
Every point has a row.
Explore the actual exported table behind Silicon Atlas. Synthetic demonstration data; all passing, failing and unknown points are retained.
Loading the source table…
Select a point to inspect its source values. Missing measurements remain missing.
Download the source CSV ↓THE REQUEST
Make the data legible.
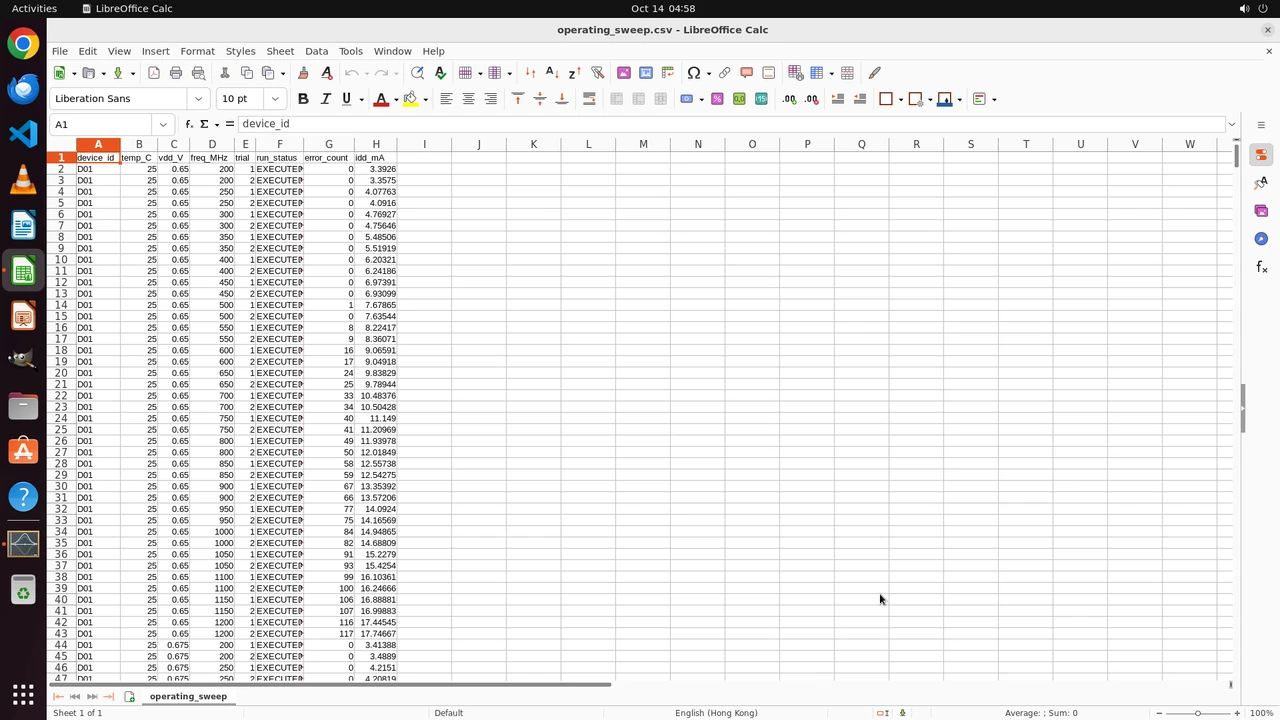
Turn synthetic chip-test logs into five editable plots, preserving repeat-aware classification, missing measurements and units.
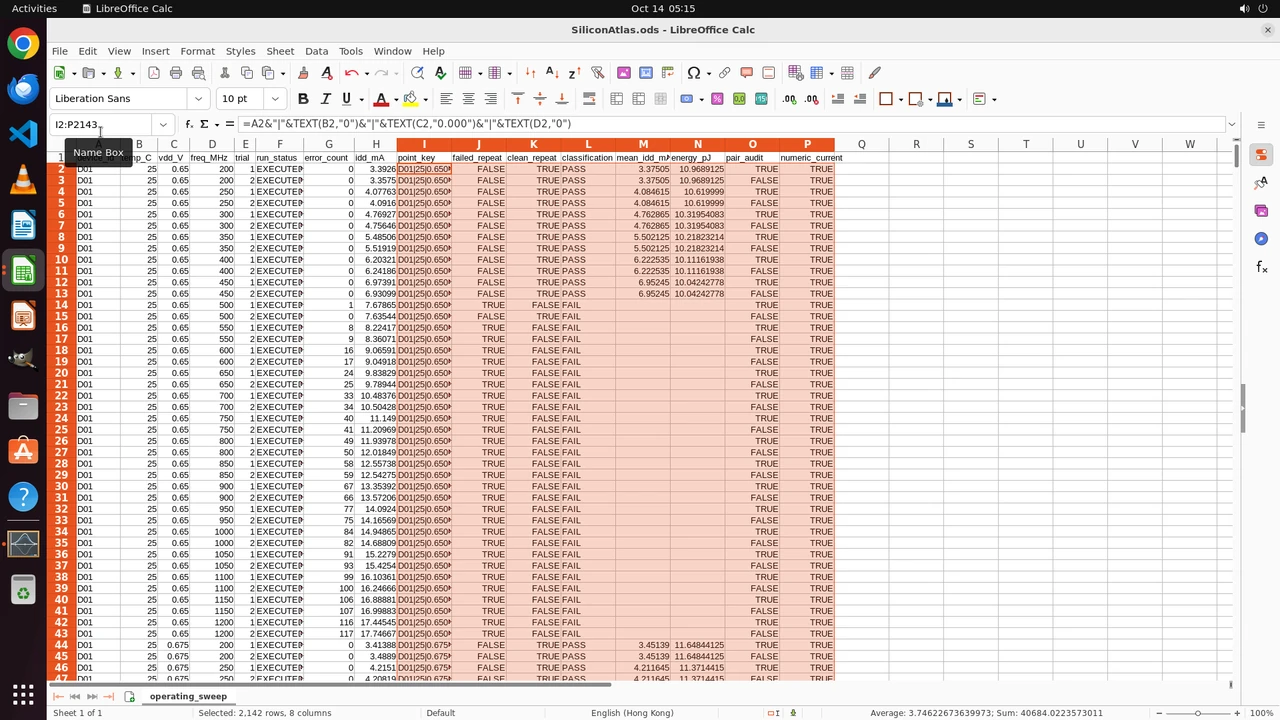
Classification rules take recorded failures first. Incomplete tests stay UNKNOWN, and absent current measurements stay missing. Energy is calculated only for passing points.
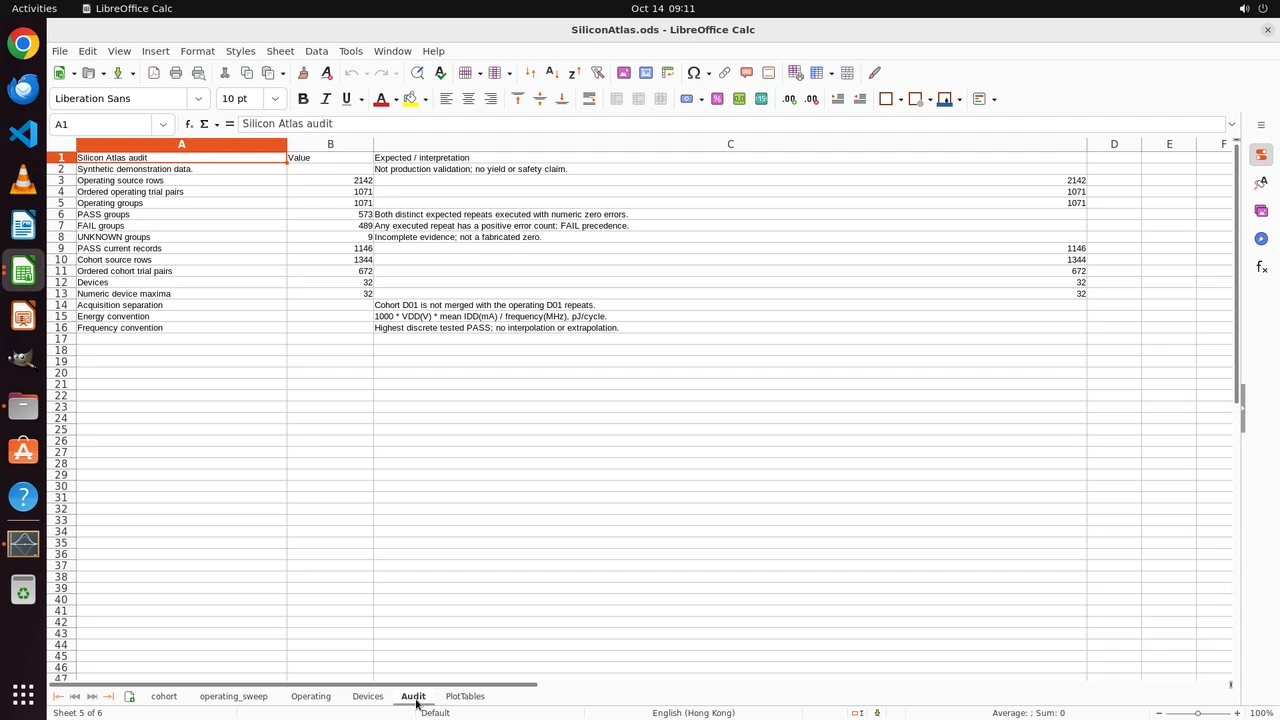
Matched temperature maps, passing-frequency maxima, energy and device counts form the atlas. Reopening the workbook checks the counts and units before final export.
2,142 sweep rows become 1,071 operating groups: 573 PASS, 489 FAIL and 9 UNKNOWN.
SELECTED RECORDED STATES
About this record
External Codex-supervised controller using NorthCUA Desktop MCP tools. Tool-interface showcase, separate from native Harness Runtime demos and NorthCUA checkpoint benchmarks.
Synthetic demonstration data, not measurements of a commercial chip. The interactive explorer uses the actual 1,071-row exported table.
Technical Report §G.2 · Figure 37 · pp. 97, 99 · 2026-11-01